

For restaurants in 2026, influencer campaign analytics and roi tracking is the line between nice content and measurable revenue. In the first two sentences you should see the point clearly: if you can’t attribute creator posts to covers, orders, and repeat visits, you’re guessing instead of growing.
Start free ROI tracking → to do it well. A clear, simple workflow, goals, KPIs, trackable links, impact windows, and fast reports, turns creative energy into predictable results your GM and accountant will both love.
Why Restaurant Influencer Campaigns Fail Without Analytics
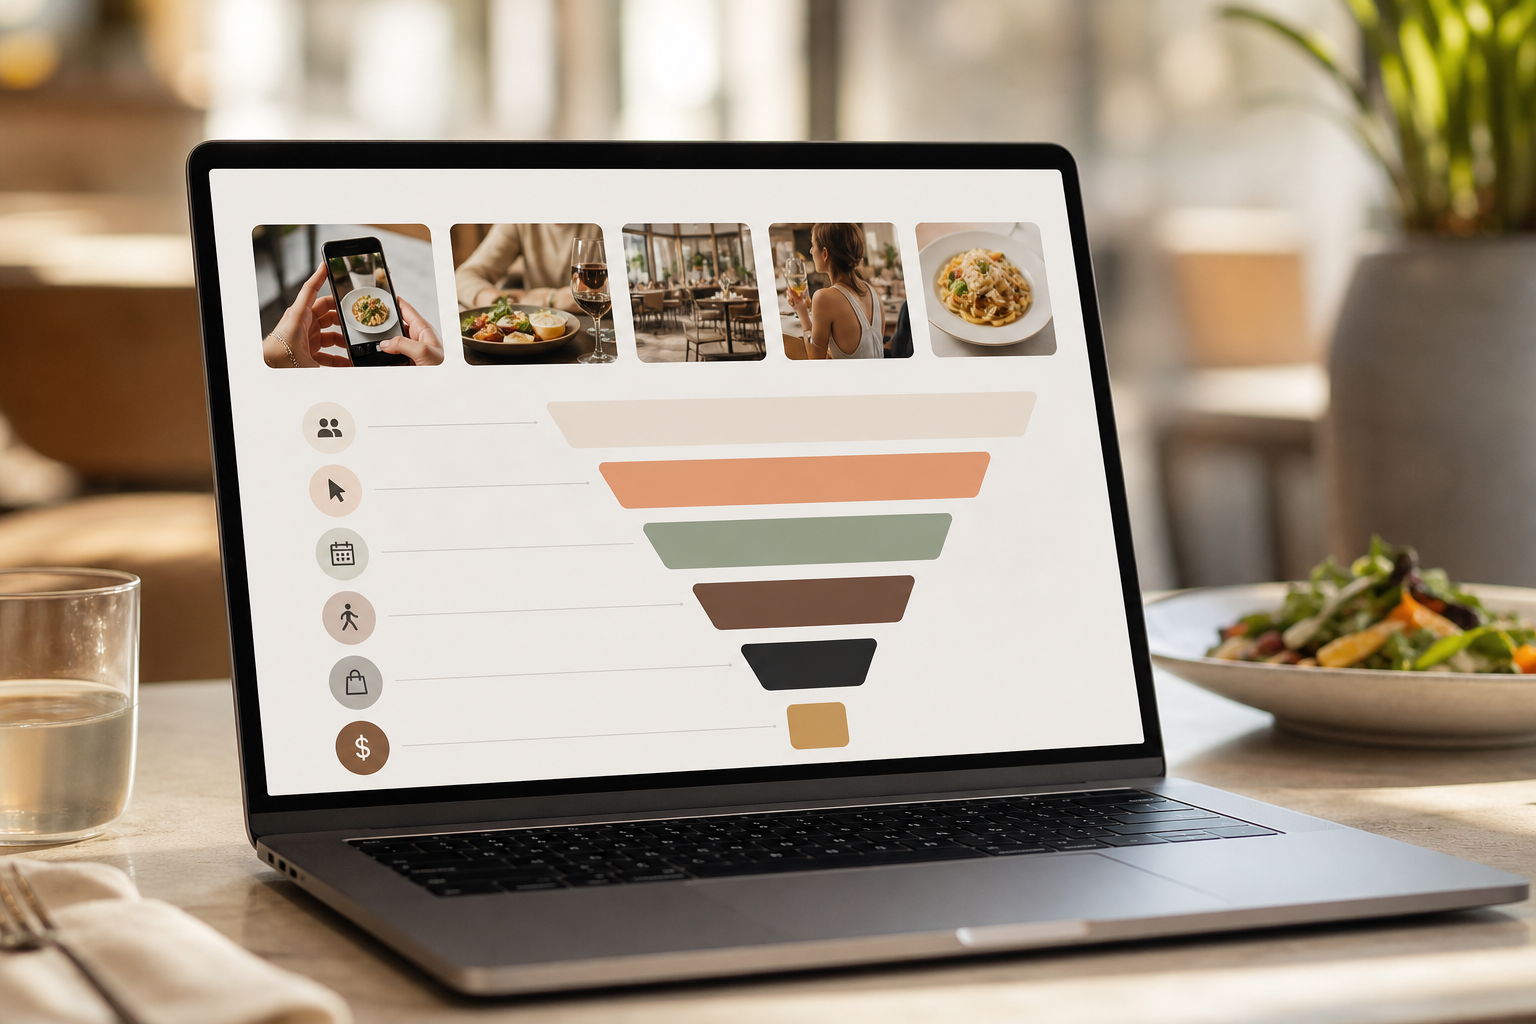
Most restaurants invest in food creators, then struggle to prove what moved the needle. The gap lives between vanity metrics and revenue. Likes and views are easy to screenshot. Covers, order volume, and repeat guests take a plan. And that plan must be simple enough to run on a busy Friday yet rigorous enough to stand up in a Monday finance meeting.
For example, a local creator drops a Reel at 6 p. m. on Thursday. The post gets 40,000 views by Friday noon. Nice.
But did your walk-in count rise after 7 p. m.? Did takeout orders with their promo code spike? Without a way to tag traffic and check the POS or bookings on that time window, you’re flying blind. Even a basic timestamp comparison, by hour, can reveal whether those views translated to butts in seats or carts checked out.
- Quick diagnostic checks you can run in under 10 minutes:
- Compare today’s 2–6 p. m. (or dinner rush) to the same weekday last four weeks for walk-ins and orders.
- Filter your POS for the featured dish to see if attach rate spiked after the post.
- Scan reservation notes for mentions of the creator name or code during the same window.
- Check Stories link click-throughs and swipe-ups during the first 2 hours to gauge immediate intent.
If you can’t tie a post to seats, orders, or a future booking, it’s a guess—not a strategy.
From views to visits: signals to watch
Moreover, different content formats create different signals. Instagram Reels and TikTok reach lots of people fast. But Saves and Shares suggest intent, which can predict visits over the next week. Comments with questions like “Is this available on weekdays?” hint at near-term demand; DMs asking for reservation links suggest immediate conversions if your link is easy to find.
Stories push quick redemptions. Long captions with a menu teaser may drive reservations for the weekend. Each needs its own target and its own way to tie back to the till. That means pairing the right CTA (reserve, order now, learn more) with a unique link or code that sits only in that post and that creator’s bio for the duration of the campaign.
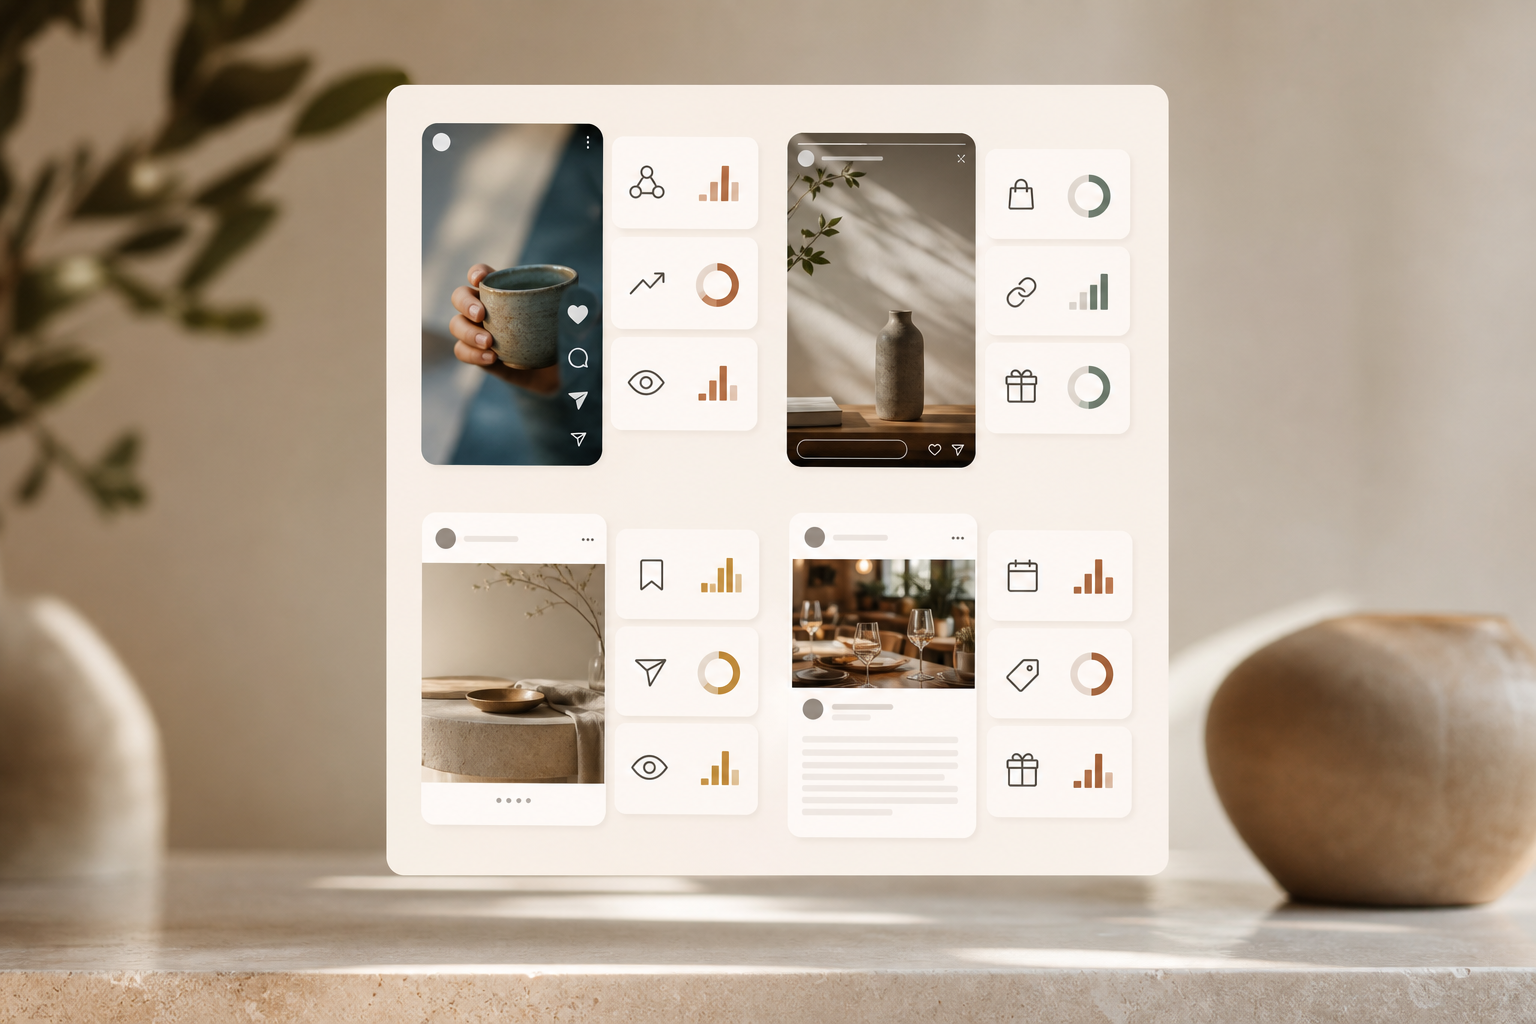
The Burger King Food Creator Campaign’s 954k views and 73% approval rate show how big creator reach can be. However, big brand stats don’t help your Friday night if you can’t trace views to seats. That’s why you need influencer campaign analytics and roi tracking that links content to an outcome you can count: covers, online orders, gift card sales, or UGC you can reuse. When a post hits, you’ll know it; when it doesn’t, you’ll know why and what to test next.
Instead of treating metrics as a catch-all list, frame them as a chain. Vanity metrics such as views, likes, and comments are awareness signals and should be read as top-of-funnel context rather than proof of sales. Outcome metrics like covers, average check, online orders, reservation conversions, and return visits are the score that matters because they hit the P&L. Between them sit bridge metrics. Saves, Shares, link clicks, and promo code redemptions, that convert attention into action and are your leading indicators that revenue is on the way.
Specifically, track the “moment of impact.” For dine-in, compare walk-ins and reservations in the 2–6 hours after a post goes live to the same hours last week. For delivery, compare order count and AOV during the post’s first 24 hours. Then note whether those gains hold over the next 7 days. Short-term bumps are nice; stacked weeks pay the bills. Adding a 28-day rolling trend line for each daypart helps you separate one-off spikes from sustainable lift.
Impact windows by channel
- Dine-in: 2–6 hours immediate, plus 7-day tail for weekend bookings.
- Delivery/takeout: 0–24 hours primary spike, plus 3–7 day repeat cycle if codes are used.
- Gift cards/catering: 7–28 days, depending on seasonality and planning horizons.
- High-consideration items (tasting menus, events): 14–28 days with weekly checkpoints.
Bridge-to-outcome examples you can model today
- Saves → visits: “Every 50 Saves on a weekend-focused Reel typically yields 6–10 incremental brunch covers within 7 days” (calibrate to your own history).
- Shares → group bookings: High Share rate on platter-focused content correlates with larger party sizes and pre-booked tables; watch average party size in the 7-day tail.
- Link clicks → reservations: A 10–20% click-to-reservation conversion is realistic for hot drops when the reservation page loads fast; annotate any site speed changes.
- Code redemptions → repeat orders: Track whether first-time code users reorder within 7–14 days; this informs allowable CPA and future creator selection.
Also Read!
Best Influencer Campaign Management for E-commerce Brands in 2026
A Step-by-Step Framework for Measuring Restaurant Influencer ROI
You don’t need a big budget or an agency retainer. You need a clear path. Use this six-step framework for influencer campaign analytics and roi tracking across every partnership. The goal is consistency: same setup, same checks, same one-page report, so you can compare creators and formats apples to apples.
Step 1: Set campaign goals you can count
First, pick one outcome per campaign:
- Covers: Fill the room this weekend.
- Online orders: Push high-margin takeout or a new combo.
- UGC library: Build 20+ photos/clips you can reuse for three months.
- Reservations: Book next week’s dinner slots.
- Brand lift: Grow Saves and Shares on a new dish ahead of a holiday.
As a result, each brief becomes tighter. Creators know the ask. You know the scorecard. Add the “definition of done” in your brief, e. g., “Success = 40 reservations created within 72 hours, CPA ≤ $15.
To go one level deeper, document exclusions so the team stays focused. Make it explicit that new followers who don’t live in your city don’t count toward the goal. Clarify that total reach without a traceable link or code is not a win because it can’t be attributed to revenue. And decide ahead of time that one-off press mentions are nice-to-haves, not campaign outcomes, unless they directly drive measurable bookings through tagged links or tracked phone calls.
Make the goal tangible (examples)
- Covers: “Add 50 incremental covers Fri–Sun, 70% within brunch daypart; keep AOV within ±5% of baseline.
- Online orders: “+90 incremental app orders in 7 days with ≥30% new customers; featured combo attach rate ≥40%.
- UGC library: “Secure 30 assets with full paid/organic rights for 90 days; reuse each asset at least twice.
- Reservations: “Create 60 reservations for next week; ≥20 parties of 3+; cancellation rate ≤5%.
- Brand lift: “Double Saves vs. 4-week median on new dish teaser; +15% branded search within 7 days.
What not to count (unless tagged and provable)
- Generic brand mentions that don’t include your tracked link, code, or a clear geotag to your location.
- New followers outside your trade area who can’t reasonably visit or order.
- Untracked reposts on aggregator pages unless you embed trackable links in captions or stickers.
- Soft signals that don’t bridge to action (e. g., “Looks tasty!”) without adjacent Saves, Shares, or link taps.

Step 2: Choose KPIs that match your goal
Second, map one to three KPIs:
- Covers goal → reservations, walk-ins, table turns
- Orders goal → order count, AOV, item mix
- UGC goal → approved assets, reuse rate, CPM-equivalent
- Brand lift → Saves, Shares, branded search, followers in your city
Therefore, avoid measuring everything. Measure the few metrics that prove the goal. Add one benchmark per KPI (baseline and target), so your end-of-campaign call is obvious without debate. If you lack a baseline, use a provisional target based on your last two weeks and revise after the first creator goes live.
- Fast baseline ideas when history is thin:
- Pull your POS hourly average for the last 2–4 comparable days (same weekday and weather).
- Use reservation creation rate by hour (not just total reservations) as a sensitivity check.
- For brand lift, take last week’s median Saves and Shares per post as your starter line.
Step 3: Create trackable links and unique promo codes
Third, make a unique UTM link and a code per creator. Use each only in their posts and bio. If you run Instagram Reels, a QR code at the end card can help. For in-person activation (e. g., a meet-up), display their code at the host stand to capture mentions reliably.
UTM hygiene that survives rush hour
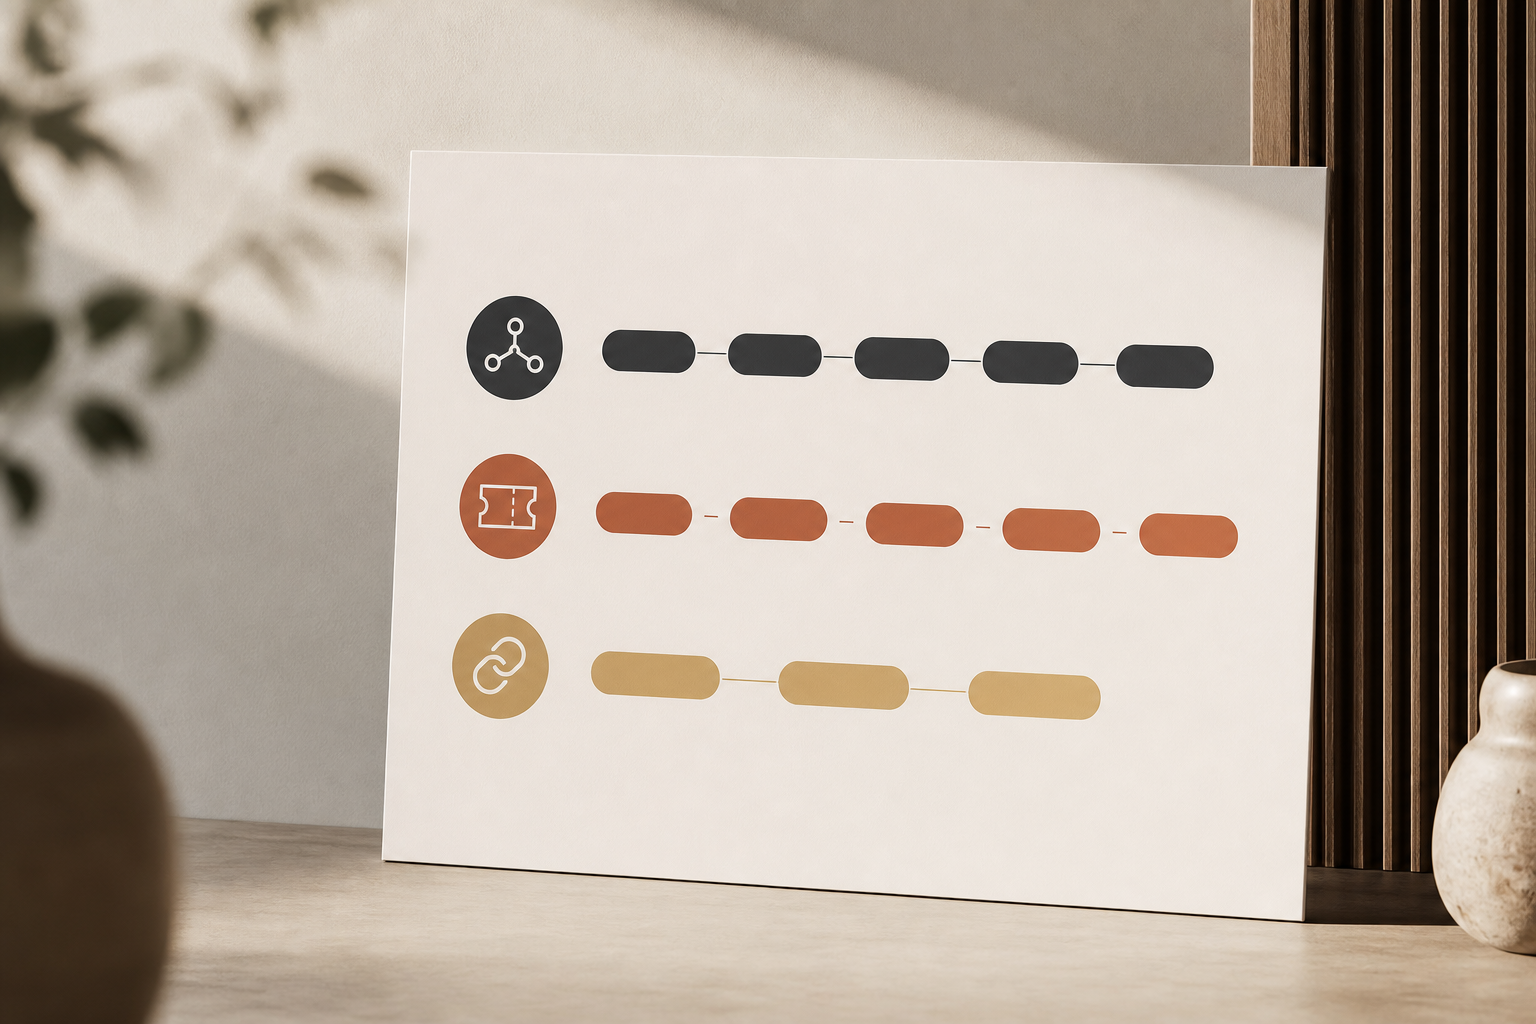
Instead of scattered parameters, set a clear pattern you can reuse. For example, use UTM source to mark the platform (e. g., instagram, tiktok, youtube), UTM medium as influencer, UTM campaign as the initiative such as march-burger-drop, and UTM content as the creator handle like saraeatsatx or javierlovespho. That way, a single look at your analytics tells you which platform, which creator, and which campaign a click belongs to, no detective work required.
- Do: Keep links short with a branded shortener; mirror code in the slug (e. g., /atx-sara-mar).
- Do: Use consistent casing (all lowercase) and hyphens to avoid duplicate rows.
- Don’t: Reuse the same link across creators or platforms; granularity matters.
- Don’t: Change tags mid-campaign without noting it in your report.
For setup basics, see Google’s campaign tagging guidance at developers.google.com. Keep links short with a branded shortener if possible. Mirror your promo code naming (e. , ATX-SARA-MAR) to reduce errors at the POS and in exports.
“Track sales, engagement, and brand lift in one place” should be your north star. If your reports live in ten tabs, you’ll stop checking them. Aim for one live dashboard and a weekly export that your GM can read without a login.
To avoid confusion across platforms, keep naming consistent but granular. Use the same UTM campaign value for one initiative across Instagram, TikTok, and YouTube so you can aggregate results at the campaign level; then vary UTM content per creator handle to compare partners fairly. For Stories with link stickers, append a suffix such as -story (e. , saraeatsatx-story) so you can evaluate Story vs.
post performance cleanly. When feasible, mirror promo codes to short link slugs (e. , ATX-SARA-MAR for the code and /atx-sara-mar for the link) so staff can recognize them instantly and guests can recall them without friction.
Standard UTM schema snapshot
- utm_source = instagram, tiktok, youtube, gbp, email
- utm_medium = influencer, paid_influencer, organic_social
- utm_campaign = yyyymm-campaign-name (e. g.
- utm_content = creator_handle[-story|-reel|-short] (e. g.
- utm_term = optional dish or offer tag (e. g.
Step 4: Measure foot traffic uplift in real time
Fourth, watch the 2–6 hour window after a post goes live. Track how many reservations are created compared with a same weekday/time baseline (for example, use an average of the last four Thursdays from 5–11 p. m.). Do the same for walk-ins by hour to catch immediate footfall changes that codes might miss. Compare POS order count and average order value against the same hours last week to detect basket-size changes. For delivery apps, review order counts against baseline and break traffic out by device type (mobile vs. desktop) to confirm a creator-driven mobile surge.
In addition, ask hosts to tag “INFLUENCER” in notes when guests mention the creator by name. Small teams beat complex setups with one simple habit like this. If your POS allows, add a quick tender/note button named after the campaign code to speed tagging. For delivery, filter online orders by code and device type; creator traffic often leans mobile, so a sudden mobile surge is a clue even when a code isn’t used.
Build your impact window tracker
If you have multiple locations, create a simple shared sheet and standardize fields so attribution holds up later. Include a timestamp column for hourly blocks, a location column to separate stores, and individual columns for reservations created, walk-ins, and POS orders. Add a notes column for mentions of the creator or code, special events, weather, or anything unusual. This small discipline lets you control for confounders like rain, a local game, or a private party before crediting the post, and it makes your retro feel rigorous rather than anecdotal.
- Recommended columns: datetime, location, reservations_created, walk_ins, pos_orders, aov, device_mix, mentions, notes
- Baseline helper: auto-calc variance vs.
- Visual cue: conditional formatting on variance cells to spot spikes quickly
Micro-case study: 72-hour burger drop
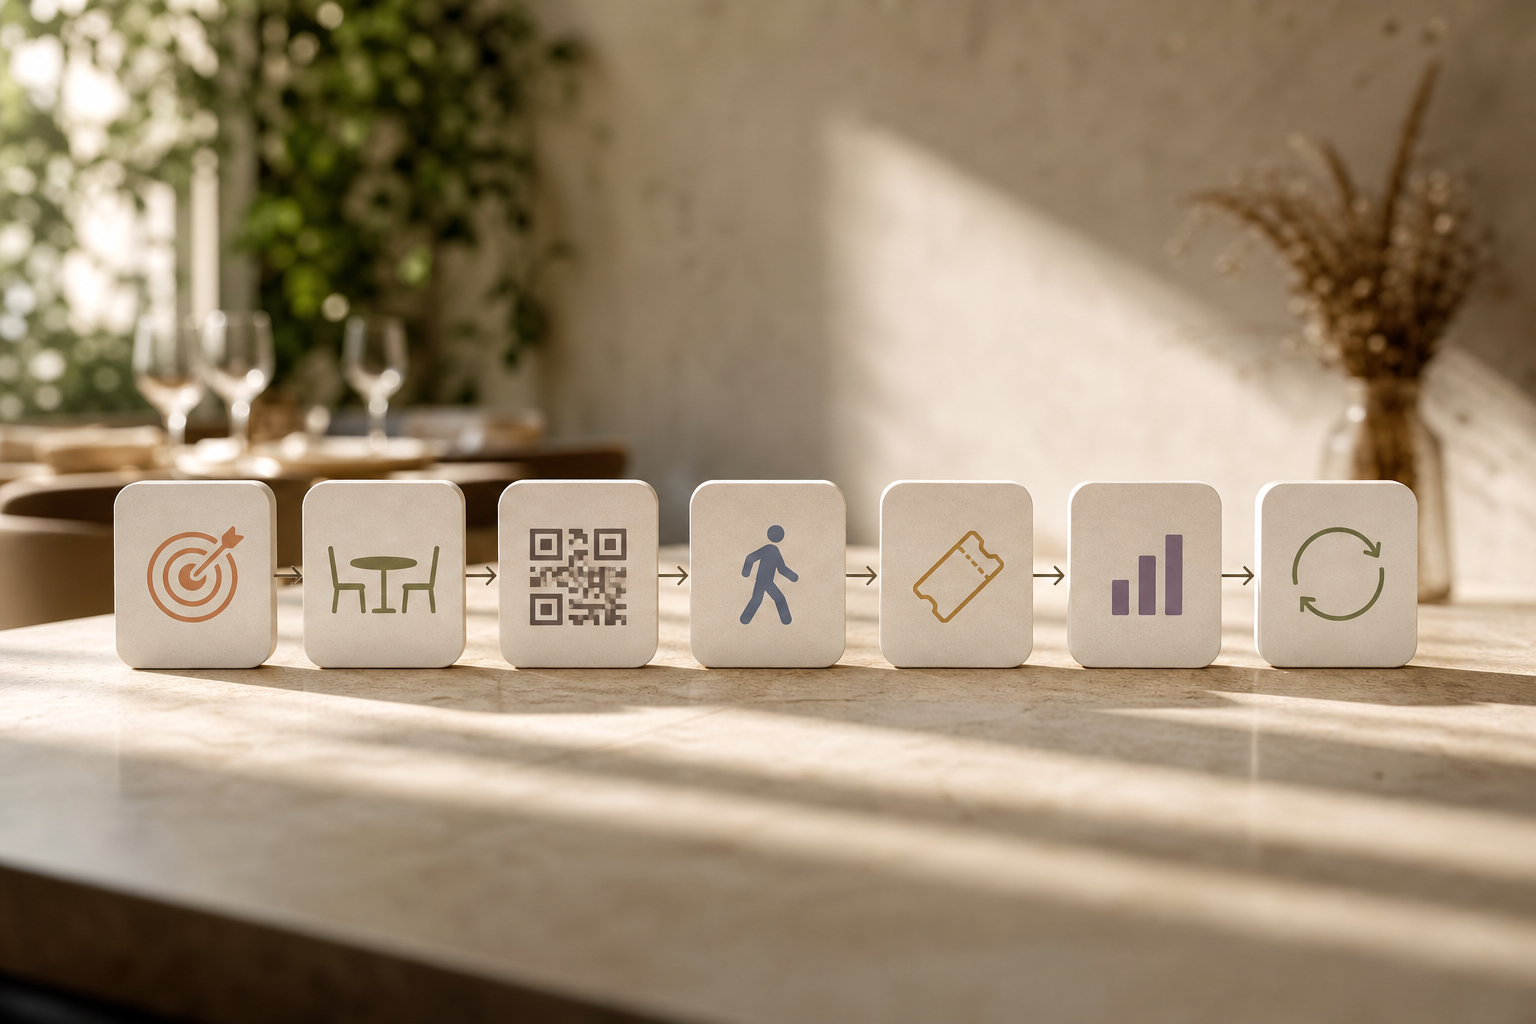
A neighborhood burger bar partnered with two micro-creators for a Thursday 5 p. m. drop. Each had a unique UTM link and QR on an end card. Hosts were briefed to tag “INFLUENCER” in notes and ask, “Did you see us on Sara or Marco’s page?
In the 2–6 hour window, reservations created were +24% vs. the 4-week Thursday baseline, with walk-ins +18%. Mobile traffic surged to 84% of online orders (normally 63%), and the featured double-smash attach rate hit 47% (baseline 29%) with AOV +9%.
- 72-hour totals: 61 attributed covers, 38 code uses, 22 note mentions without code
- CPA: $560 total cost ÷ 61 = $9.
- Action: Extend Sara with a weekend Story; tweak Marco’s CTA to push more link taps
Confounders to log before you credit a spike
- Weather shifts (rain, heat wave, snow) that typically alter foot traffic.
- Competing local events (sports, concerts, festivals) near your location.
- In-house promos (happy hour changes, live music) that launched the same day.
- Operational constraints (kitchen down a line, staffing shortages) that affect throughput.
- Platform anomalies (IG outage, TikTok audio trends) that skew visibility.
When in doubt, annotate the spike and split credit conservatively; you can always adjust after a second confirming post.
Step 5: Calculate cost per acquisition vs. your average ticket
Fifth, add up campaign costs: creator fee, comped meals, boosted spend, and staff time estimate. Then divide by attributed covers or orders.
- CPA (dine-in) = total cost ÷ attributed covers
- CPA (online) = total cost ÷ attributed orders
Then compare CPA to your average ticket. If CPA < 25–35% of your ticket and your food cost is in line, you’re in a good zone. If it’s higher, fix targeting, offer, or the content brief before you scale.
Finance gut-check: If this guest cost what they cost today, would you buy them again tomorrow?
Don’t guess; run the math. When possible, layer in LTV: if a first-time diner returns twice in 60 days, your allowable CPA can be higher than a single-ticket view suggests. Document your assumptions (repeat rate, contribution margin) so future campaigns use the same yardstick.
To standardize post-campaign math, expand your report template with a few fields that make decisions faster. Capture total campaign cost, including cash and in-kind comps, so there’s no confusion about the denominator. Split attributed guests into new vs.
returning to clarify whether you’re buying trial or loyalty. Note the attach rate of featured items so you can see if the creative moved the dish you actually wanted to sell. Finally, translate topline revenue into incremental margin dollars to avoid celebrating unprofitable volume.
Common CPA pitfalls to watch
- Over-attributing lift on peak holidays; trim your attribution percentage during obvious spikes.
- Ignoring staff time; record setup and service minutes so “free” work is accounted for.
- Counting unredeemed codes as conversions; use POS-confirmed redemptions or time-bound notes.
- Comparing creators with different offers; normalize CPA by aligning promos before testing.
Mini-ROI model example (plug in your numbers)
- Assumptions: Avg ticket $38, contribution margin 68%, target CPA ≤ 30% of ticket ($11.40).
- Costs: Creator fee $400 + comps $80 + boost $120 + staff time $50 = $650 total.
- Attributed outcomes: 55 covers in 72 hours; 20 are new guests, 35 returning.
- CPA: $650 ÷ 55 = $11.82 (slightly above target); margin revenue: 55 × $38 × 0.68 = $1,419.
- Next move: Improve hook/offer to push CPA under $11 or negotiate fee; keep creator due to strong new guest share (36%).
Step 6: Report, learn, and iterate
Sixth, ship a one-page report within 72 hours:
- Goal, content links, live time
- KPIs vs. target and baseline (show pre- vs.
- Sales impact (covers/orders, AOV)
- What worked, what didn’t
- Next test (hook, angle, format, or offer)
In 2026, simple, real-time performance tracking and analytics beat long decks. Share wins and misses with the creator. Good partners care about results, not just reach.
That’s how you build long-term lift, not one-and-done spikes. Close the loop by scheduling a 10-minute retro: confirm what to keep, what to tweak, and whether to extend or pause. Over time, a tight feedback loop is your competitive edge.
To keep momentum, schedule a recurring 15-minute “ROI standup” with your GM and marketing lead. In that quick huddle, review active creator impact windows and what’s scheduled to go live next. Compare yesterday’s numbers against your baselines and highlight any anomalies that need a follow-up. Confirm that on-premise signage, QR codes, or code displays are in place and visible. Then greenlight the next briefs based on what the data says, not on hunches.
Cadence that compounds
- Monday: Review last week’s impact windows and finalize this week’s briefs.
- Midweek: Check creative drafts for clear CTAs, unique links, and disclosure.
- Go-live day: Staff reminder in pre-shift; verify QR/code visibility; open dashboard.
- +24 hours: Export quick results; share micro-learnings with creator.
- +72 hours: Ship one-pager; decide to extend, tweak, or pause.
Also Read!
Best AI Influencer Matching for E-commerce Brands in 2026
How to Track Influencer Campaign Analytics for E-Commerce Brands
5 Analytics Mistakes Restaurants Make With Influencer Campaigns
Even smart teams slip on the same five banana peels. Fix these, and your results get clearer, and cheaper. Use this as a pre-launch checklist every time you brief a creator.
-
Obsessing over follower count instead of local reach
A million followers with 2% in your city won’t fill Saturday night. Ask for city-level audience data or look for creators who post from your neighborhood. As a result, you’ll get fewer “wow” numbers, but more butts in seats. Bonus: check audience language and age; a late-night crowd may be perfect for a midnight menu but wrong for a family brunch push. -
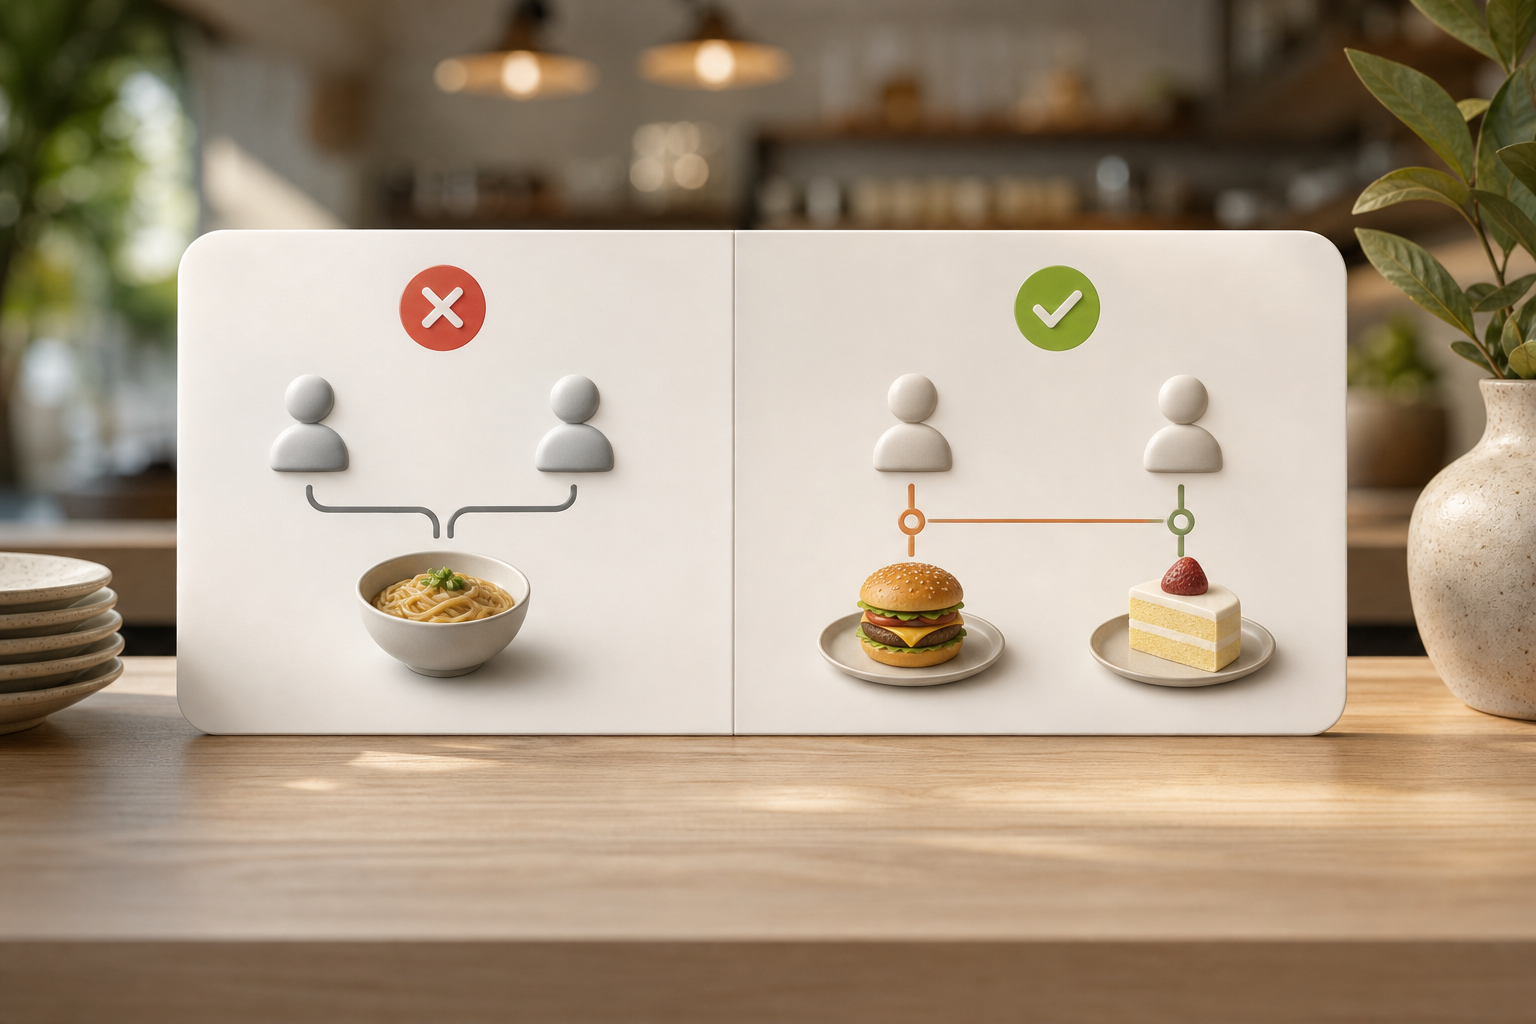
Not giving each creator a unique code
If two creators share the same link or code, you’ll never know who drove orders. Moreover, cross-posts get muddy across Instagram Reels, TikTok, and YouTube Shorts. One creator, one code. Always. If you do a multi-creator drop on the same day, still separate codes and UTMs; then compare CPA and Save rates to spot the best fit for your brand.
- Ignoring Save and Share rates on food content
Likes are fast. Saves and Shares show intent. Specifically, a high Save rate on a “how to eat our birria taco” clip hints at a weekend visit surge. Add these to your dashboard alongside clicks and redemptions.
You need data-driven insights to improve influencer campaigns, not screenshots of hearts. Translate Saves/Shares into forecasts: e. g., “Every 100 Saves typically yields 12 extra covers within 7 days” based on your last 5 posts.
Quick fixes for common pitfalls
- Ask for city-level audience screenshots on every brief and contract.
- Enforce one link + one code per creator per platform; no exceptions.
- Add Saves/Shares to your impact window sheet; track Save-to-visit ratios.
- Review a 7-day tail in every recap; don’t stop at same-day metrics.
- Measuring only same-day results
Some posts spark a Friday rush. Others plant a seed guests act on next week. Therefore, check a 7-day tail, not just launch day.
For dine-in, watch next-week bookings. For takeout, track repeat orders that use the creator’s code. Extend to 28 days if you’re promoting seasonal dishes or events; some audiences plan further out, especially for groups.
- Failing to track the reuse value of UGC
You pay for content once. You can run it again and again (with rights) on your menu boards, Google Business Profile, and ads. Tools that catalog UGC and show its reuse value can turn a break-even post into a win. In short, use user-generated content for social campaigns with better engagement and higher ROI. Always secure asset rights up front (organic, paid, duration, and allowlisting) and log expiry dates to avoid takedown surprises.
“Their honest reactions did more than any banner ever could. Engagement shot through the roof, and our Discord community doubled.” — PlayForge
Finally, write these five on your prep board. If you’re under pressure, you’ll forget one. A checklist saves you real cash. A laminated “go-live card” next to the host stand, with code, link, and note-taking reminders, can be the difference between fuzzy and definitive attribution.
Mistake-spotting checklist before you post
- Unique UTM and promo code confirmed per creator and per platform.
- City-level audience concentration verified (≥60% within trade area, if possible).
- Clear CTA with a fast-loading landing page tested on mobile.
- Rights and disclosures locked (organic, paid, allowlisting, duration).
- Baselines documented and impact window tracker prepped.
Tools and Platforms for Restaurant Influencer Analytics
You can track a lot for free. And you can go deeper with dedicated platforms. Here’s a clear lay of the land for restaurants. Pick the lightest stack that still answers the CFO’s two questions: “What did we spend?” and “What did we get?
Stack philosophy: start light, scale smart
- Prefer first-party signals (UTMs, QR scans, reservation notes) before pixels.
- Standardize naming and baselines so comparisons stay clean as you add tools.
- Centralize reports in one live dashboard and one weekly one-pager.
- Add paid tools only when they cut time, improve accuracy, or unlock rights/workflow.

Free stack: links, analytics, and booking reports
- UTM links: Tag every creator link. Store them in a shared sheet tied to each post date. See Google’s docs at developers. google. com/analytics for setup details (one link is enough). Use the same campaign name across platforms to aggregate, and vary content for creator handles.
- Google Analytics 4: Filter by UTM tags to see clicks, sessions, and conversions for online orders or gift cards. Build Explorations that segment by source/medium and device; save a “Creator Traffic” view you can refresh during live windows.
- Reservation systems: Pull same-day and next-7-day reservation reports from OpenTable or SevenRooms. Compare live windows to last week. If available, tag reservation notes with the creator code to strengthen attribution beyond UTMs.
- POS exports: From Toast, Square, or Clover, export order counts and AOV by hour. Tie spikes to post times. Create a simple “Impact Window” tab in your sheet to paste hourly exports and auto-calc variance vs. baseline.
- Manual QR codes: Print creator-specific QR codes for table tents or Stories. Track scans during the window. For any on-premise signage, add short copy (“Scan to unlock Sara’s special”) to boost scan-through.
- Google Business Profile: Add tracked links in your website and order buttons, and note Save/Call spikes around campaign windows as a supporting signal.
“We used nothing more than UTMs, a QR code, and our reservation notes, and still proved a 19% lift on a rainy Thursday. The chefs got skeptical, then they saw the sheet.” — GM, Midtown Tap
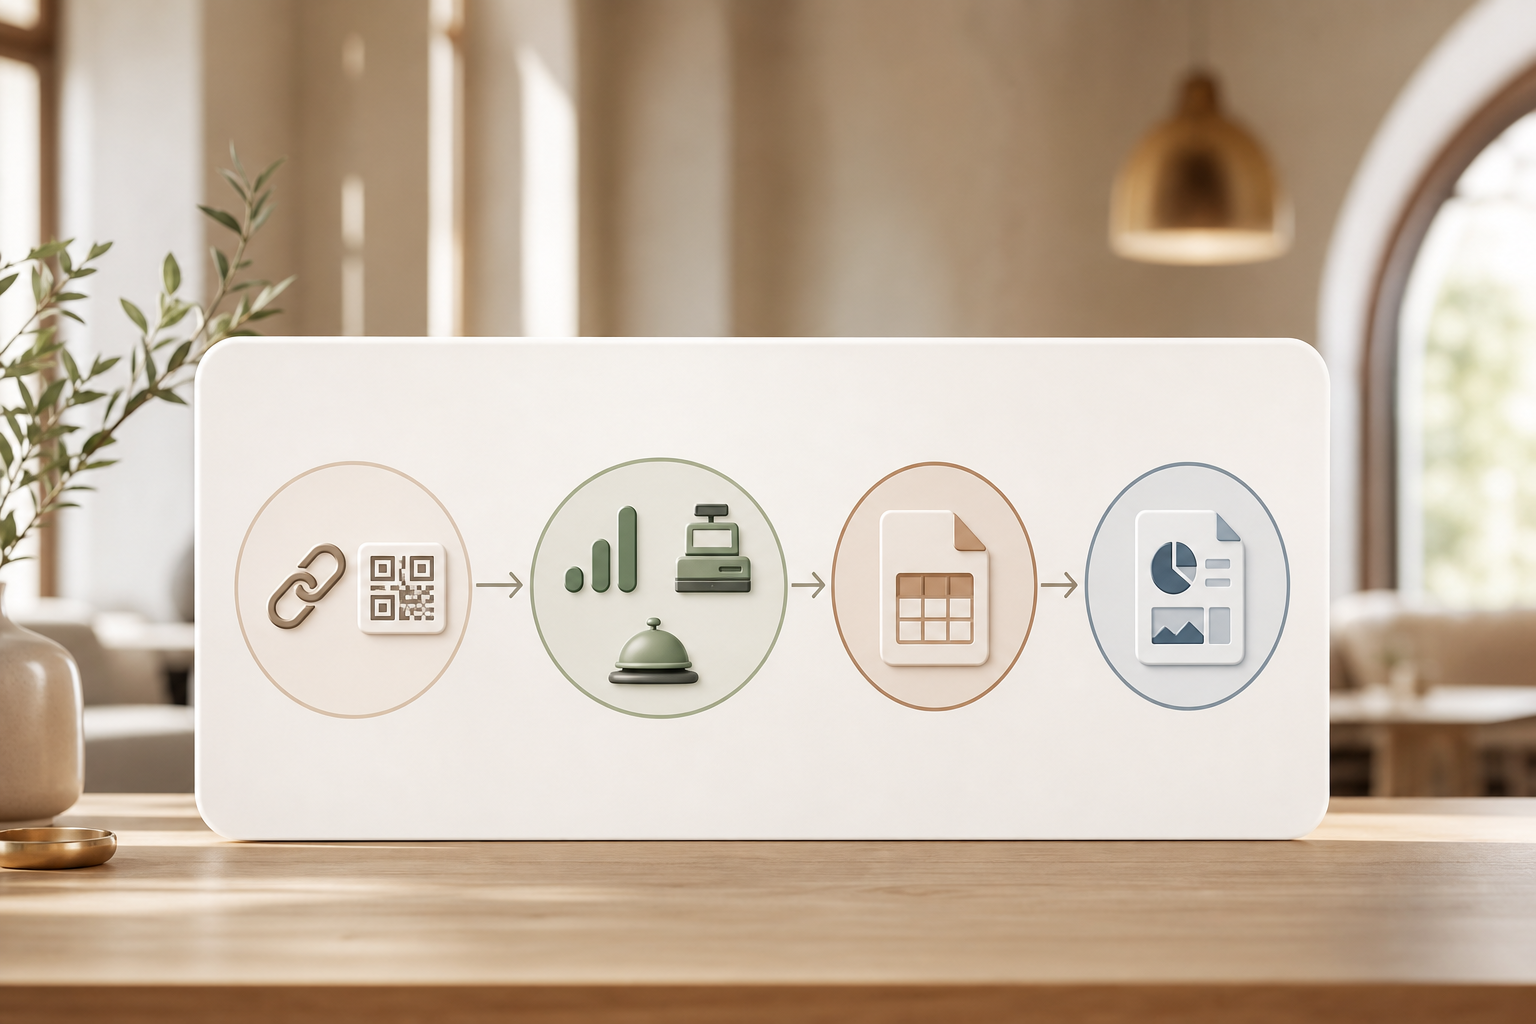
Lightweight workflow blueprint (free stack in action)
- Before go-live: Create UTM link + promo code, print a QR, brief hosts on mention notes.
- During impact window: Open GA4 Exploration + POS by-hour report; log hourly deltas.
- After 72 hours: Export totals, compute CPA, add what-worked/what-didn’t; update creator leaderboard.
Paid platforms: unify data, content, and workflow
If you want everything in one place, consider tools like Infliuence, Sprout Social, and Later. For restaurants, one option is Infliuence, an AI-powered platform that connects brands with influencers. It offers Smart Analytics & Reports with real-time performance tracking, AI creator matching, contracts, automated payouts, and tax form handling. It’s trusted by 50,000+ brands and creators, including luxury brands, resorts, restaurants, and salons. Most users are Live within 24 hours, and signing up is completely free. Mentioned results include the Olay Skincare Summer Campaign at 1.02M views and an 84% approval rate. Beyond reporting, unified briefs, allowlisting, and content rights tracking reduce the back-and-forth that often kills momentum mid-campaign.
To evaluate platforms objectively, run a two-week trial with a micro-campaign:
- One creator per platform, same brief and goal
- Predefined impact window and baselines
- Score on setup time, live tracking clarity, and report quality
“Centralizing briefs, UTM hygiene, and payouts in one tool cut our admin time by 70% and made retro calls painless.” — Marketing Lead, Neighborhood Group
What to look for in 2026
Real-time dashboards should let you see clicks, promo code redemptions, and Saves/Shares as posts go live so you can flex staffing for the dinner rush or turn ads on/off quickly. Reliable attribution features matter, including per-creator links and codes and an easy way to import reservation and POS data without manual copy-paste. UGC tracking is increasingly essential: look for a library that manages usage rights, shows reuse dates, and surfaces which assets perform best when repurposed in ads. City-level reach filters will save you from paying for irrelevant eyeballs by prioritizing creators near your location, not just big numbers. Privacy-resilient measurement, cookie-light tracking and first-party data options, keeps your reporting stable when platforms update policies. Simple LTV modeling that converts first orders into projected repeat revenue helps you set smarter CPA targets. Finally, team workflows like brief templates, approval flows, and asset expirations with alerts ensure nothing slips during peak service.
- 2026 checklist of must-have capabilities:
- Real-time view of link clicks, Saves/Shares, and code redemptions as posts go live.
- Per-creator attribution across platforms with painless import of POS and reservation data.
- UGC library with rights tracking, expiry alerts, and performance insights by asset.
- City-level and neighborhood filters for creator discovery and audience fit.
- Privacy-safe analytics with first-party event tracking and consent-aware GA4 setups.
- LTV modeling that turns first orders into projected repeat revenue and allowable CPA.
- Workflow tools: brief templates, approvals, content calendars, and alerting for expirations.

If you work with creators too, you’ll like seeing the other side of the fence. Share this with partners who want to grow with you: How to Track Influencer Campaign Analytics as a Creator.
Get real-time analytics free → so your “uplift” is apples to apples every time.
Also Read!
Infliuence vs Grin for E-Commerce Brands: Which Is Better for Influencer Campaign Analytics?
Best Influencer Campaign Analytics for E-Commerce Brands in 2026
Frequently Asked Questions
What’s the simplest way to attribute walk-ins when guests don’t use a code?
Start by training hosts to write a quick note whenever someone says “saw you on TikTok/IG” or mentions the creator’s name. Pair that with a small sign at the host stand, “Mention SARA for a free churro today”, so you get a consistent prompt without discounting your core menu. Next, compare the 2–6 hour impact window against your 4-week weekday baseline; if walk-ins jump 30% and mentions spike concurrently, you can attribute a meaningful share of the lift to the post. In your report, be explicit about assumptions (e. g., attributing 60–80% of the net lift) so your finance lead understands the math.
What’s a good CPA for restaurant influencer campaigns?
Use your average ticket and contribution margin as guardrails and treat CPA as a variable you actively manage. A practical rule of thumb is to keep CPA at or below 25–35% of your average ticket for single-visit profitability, assuming food and labor costs are steady. When your repeat-visit rate is strong (for example, 2–3 visits in 60 days), your allowable CPA can rise because LTV covers the gap. Document the LTV logic in every report so approvals stay consistent across campaigns and managers.
How long should my attribution window be?
Time your windows to the guest behavior you’re trying to influence. For dine-in pushes, monitor a 2–6 hour immediate window and a 7-day tail for weekend bookings. For delivery/takeout, the main spike typically falls within 24 hours, followed by a 3–7 day repeat cycle if you use creator-specific codes. For seasonal/menu launches, add a 28-day rolling trend to see if awareness translates into sustained lift rather than a one-day pop.
Do promo codes train customers to expect discounts?
Not if you design them as identifiers for experiences instead of perpetual coupons. Position codes as limited-time “Creator’s Combo,” early access to a new dish, or a small value-add like a free dip or priority waitlist, which protects margin while improving attribution. Rotate code benefits and set clear expiry dates so guests learn that codes are occasion-based, not a standing discount. Over time, you’ll get reliable data without conditioning guests to wait for discounts.
How many creators should I test before scaling?
Plan a 4–6 week pilot with 4–6 local creators who actually dine in your neighborhood. Keep the brief, goal, and offer constant so you can compare apples to apples on CPA, Save rate, code redemption rate, and AOV change. Use mid-pilot check-ins to pause underperformers and double down on top performers for the back half of the test. By week six, you should have a ranked list that informs your next quarter’s budget.
What baselines should I use to judge uplift fairly?
Anchor your analysis to the guest’s routine by using a rolling 4-week average for the same weekday and daypart. Exclude clear outliers such as holiday weekends or severe weather, and note those exclusions in your report to maintain trust. When in doubt or when seasonality is spiky, add a 28-day trend chart so anomalies don’t drive decisions. The more transparent your baseline logic, the easier stakeholder buy-in becomes.
How do I attribute across multiple locations?
Create unique UTM links and promo codes per location per creator (e. g., ATX-SARA-MAR vs. DAL-SARA-MAR) so your data slices cleanly. Split your impact window sheet by location, and make staff notes mandatory at each host stand to capture mentions. For delivery, route guests to location-specific ordering pages from each creator’s link so online sales attribution is explicit. In your recap, present both per-location results and a rollup to show the full campaign picture.
What privacy-friendly methods can I use without complicated pixels?
Lean into first-party signals that don’t rely on cookies: UTM-tagged links, QR codes, and reservation notes. Configure GA4 with consent-mode and track on-site actions like book, order, and call, which map directly to revenue. Replace pixel-heavy retargeting with creator-led remarketing, e. g., a second post summarizing fan questions, that you can still measure via codes and tracked links. You’ll stay compliant while preserving your attribution trail.
How does influencer campaign analytics and roi tracking help creators, too?
Clear goals and KPIs give creators a tight brief so they can choose hooks, CTAs, and formats that convert rather than guess. Post-campaign learning, what drove Saves, comments, and code uses, helps creators refine their style and cadence, which improves results for both sides. Transparent reporting builds trust and justifies higher fees for top performers while keeping underperforming concepts from repeating. Everyone wins when data guides the next idea.
Should I boost a high-performing creator post, and how do I track it?
Yes, if the organic post shows strong bridge and outcome metrics, a small boost can extend the window and compound results. Create a separate short link and UTM set for the boosted spend (e. g., utm_medium=paid_influencer) so performance isn’t muddied with organic. Cap spend to a target CPA and watch hourly returns so you can cut off quickly if results decay. In your report, show organic vs. paid side by side to make future decisions cleaner.
How do I handle attribution if my restaurant doesn’t take reservations?
When you can’t rely on bookings, make walk-in notes, QR scans, and code mentions your primary signals. Add a “creator special” that’s only available on the day of the post so guests have a reason to mention or scan. Compare hourly POS orders and AOV to the 4-week baseline and attribute a conservative share of the net lift to the campaign when notes and scans spike. Over time, calibrate your attribution percentage based on repeated patterns.
What if a creator’s post goes viral outside my city?
Celebrate the reach, but reset your expectations to local conversion. Check city-level analytics wherever available and prioritize comments/DMs from locals with clear intent. If non-local traffic dominates, quickly post a locally focused Story with a city-tagged link and code to funnel real prospects back into a trackable path. In your debrief, note the lesson: prioritize creators whose audience concentration matches your trade area.
How should I set an initial budget for creator tests?
Back into spend from your allowable CPA and realistic volume. If your average ticket is $40 and your target CPA is 30% ($12), and you expect 60 attributed covers from a micro-creator, your working budget per test is about $720 plus comps. Spread risk by running 4–6 micro-tests rather than one large bet, and reserve 10–20% of the pilot budget for boosting proven posts. Use the first two weeks to recalibrate CPA targets before scaling.
How do I compare influencer campaigns to paid social ads fairly?
Hold the offer, landing page, and geo-targeting constant, then run them concurrently for a clean read. Tag traffic distinctly (e. g., utm_medium=influencer vs. utm_medium=paid_social), and measure on the same KPIs and windows. Beyond CPA, include Save rate, content reuse value, and incremental branded search as secondary tie-breakers. Often, creator content plus light boosting delivers superior CPMs and higher trust, even at similar CPA.
How can I measure gift card sales influenced by creators?
Add a gift-card-specific landing page and tag it with creator UTMs so you can track clicks and conversions directly. Pair that with a lightweight code (e. g., SARA-GC) for in-store purchases that staff can enter at checkout as a note. Review both online and in-store gift card sales during the impact window and the following 7 days, then attribute lift similarly to dine-in or delivery. In holiday seasons, extend your tail to 28 days to catch late buyers.
What do I do if multiple creator campaigns overlap?
Plan your calendar to avoid too much overlap, but when it happens, rely on strict code/UTM hygiene. Stagger post times by at least a few hours and assign distinct offers or menu items to each creator to separate demand signals. In your sheet, log precise timestamps and annotate notable spikes so your attribution split isn’t guesswork. If overlap is unavoidable, allocate lift proportionally based on code redemptions and link clicks during each creator’s impact slice.
Are there FTC or local disclosure rules I need to follow?
Yes, ensure creators disclose partnerships with clear “ad” or “sponsored” labels per FTC guidance, and keep those disclosures visible in Reels, Stories, and captions. Include disclosure requirements in your contract and review drafts before posting to avoid takedowns or fines. For in-person events, post signage noting the partnership if you’re filming guests for UGC. Compliance protects your brand and keeps platforms from throttling your reach.
What KPIs differ for brunch vs. dinner pushes?
Match KPIs to daypart behavior. For brunch, prioritize parties-per-hour, waitlist growth, and family-friendly items’ attach rate; Saves from Friday posts often translate to Sunday visits. For dinner, watch reservations created within 2–6 hours, AOV lift from shareable plates, and late-night walk-ins driven by Stories. Build separate baselines by daypart so you’re not comparing apples to oranges in your retro.
Your 7-Day Action Plan
- Day 1: Audit your last influencer post. List goals, KPIs, and what you actually measured.
- Day 2: Create a UTM template and a code naming system per creator and platform.
- Day 3: Pull a 4-week baseline for reservations, walk-ins, orders, and AOV by hour.
- Day 4: Draft a creator brief that states the single goal and the code/link to use.
- Day 5: Set up a simple “impact window” tracker for the 2–6 hours after posts go live.
- Day 6: Build a one-page report template: goal, KPIs, sales impact, learnings, next test.
- Day 7: Book one local creator for next week. Share the brief and the tracking links. If they want creator-side tips, send them this: see this creator playbook.
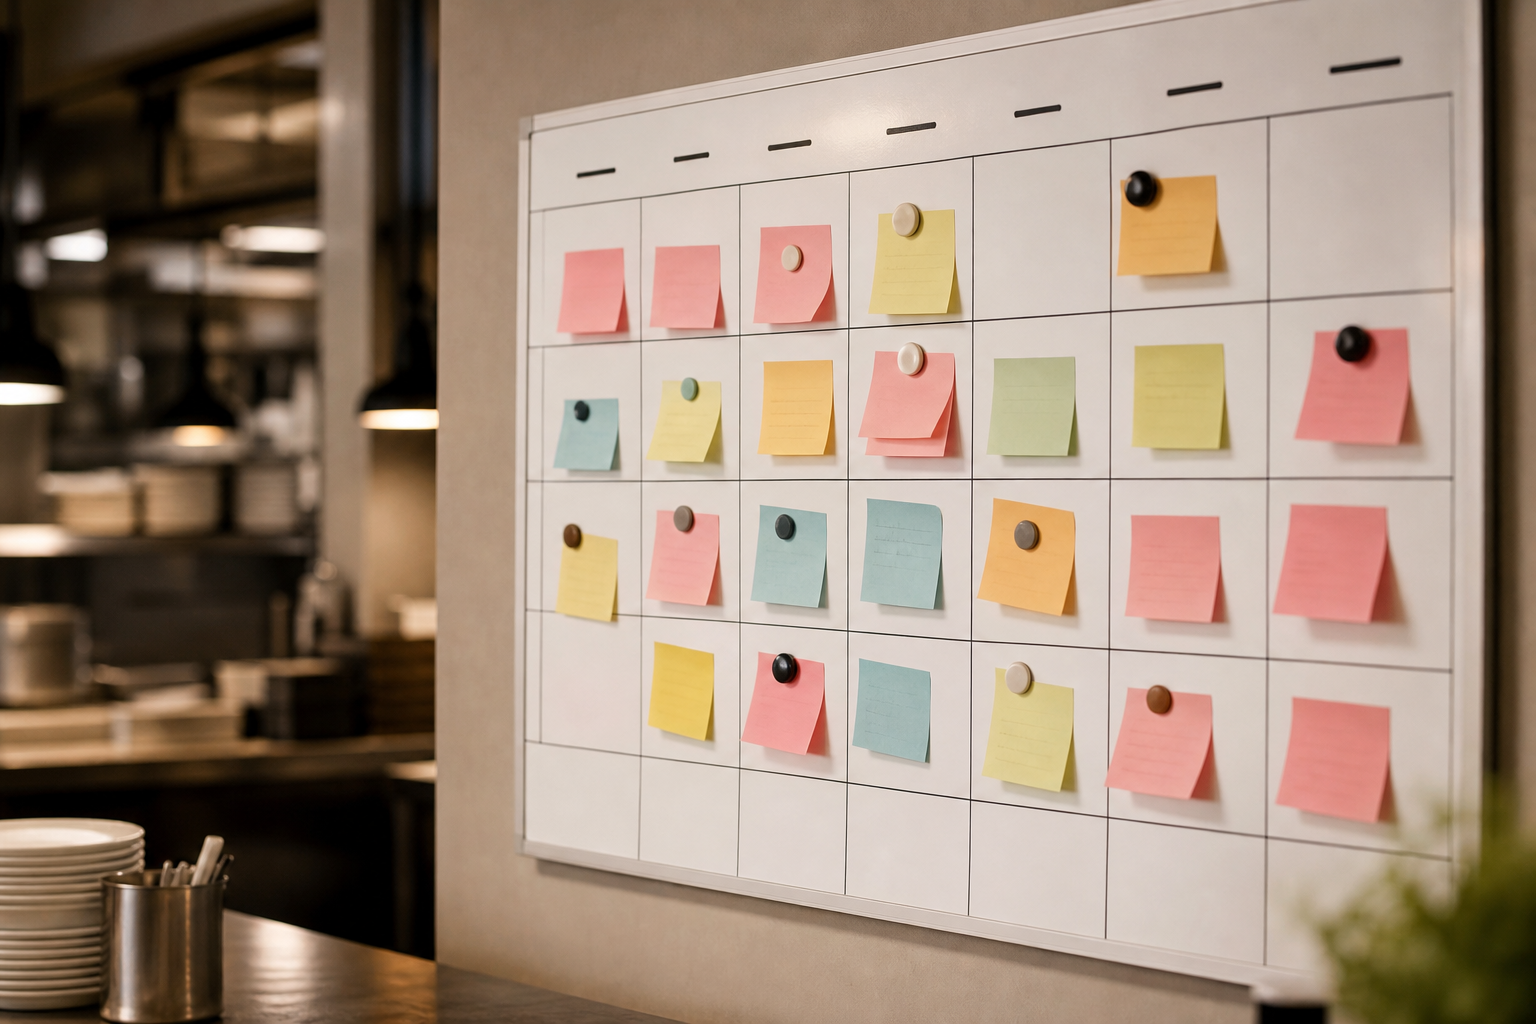
In addition, add a calendar reminder to review results 72 hours after each post. Then measure again at 7 days. Consistent checks build consistent wins. Over a quarter, you’ll have enough data to rank creators, formats, hooks, and offers, and shift budget to the top performers with confidence.
Pro tips for the week
- Keep a printed “impact window” cheat sheet at host stand with creator name, code, and note prompts.
- Dry run your links and codes on your phone; fix any slow loads or 404s before go-live.
- Prep a follow-up Story template to repost top comments and extend the window.
- Photograph any on-prem signage with time stamps to confirm in-place execution.
- Archive all creative and metrics in a shared folder so future hires can learn fast.
Finally, you have the plan, the steps, and the tools. Your next creator post should link cleanly to covers, orders, or a UGC library you can use for months. That’s how you shift from guesswork to growth in 2026. Even better, when your team can answer “What did this post do for us?” in 30 seconds, you’ll unlock faster approvals, happier partners, and a playbook you can rinse and repeat.