


Most brands running influencer campaigns in 2026 can tell you their total views. Almost none can tell you their cost per acquisition by creator. That gap — between what’s easy to pull and what actually matters — is where influencer budgets quietly disappear.
This isn’t an overview. It’s a specific, opinionated workflow for setting up ROI measurement before your next campaign launches, reading the numbers honestly once it ends, and building the kind of creator ranking system that compounds over time.
The Formula — And What Most Brands Get Wrong About Cost

The math itself is straightforward. As outlined in Influence’s 2026 campaign analytics guide:
ROI = (Revenue Attributed − Campaign Cost) ÷ Campaign Cost
What breaks the calculation is the cost side. Brands routinely count only the creator’s fee and skip everything else. The full CPA definition should include creator fees, gifted product at cost (not retail), media boosts behind whitelisted posts, editing and licensing fees, shipping, and any UGC allowlisting costs. A campaign that looks like a 4:1 winner on creator fee alone often lands closer to 2.5:1 once everything is counted. That’s not a disaster — it’s an honest number you can actually scale on.
ROAS vs. ROI — Stop Using Them Interchangeably
Return on ad spend uses gross revenue against media spend only. ROI nets out full cost. Use ROAS when you’re comparing a boosted creator post against your Meta campaigns. Use ROI when you’re deciding whether the whole influencer program earns its annual budget. Reporting one and calling it the other is how brands systematically mislead their own leadership teams.
For context on where the industry benchmarks sit: research compiled by Improvado puts the average at $6.50 returned for every $1 spent on influencer marketing — but most brands can’t prove it because the attribution stack isn’t in place before launch. Separate data puts the average at $5.78 per dollar, with top-performing campaigns reaching $18–$20 — outperforming traditional digital channels. The spread is enormous, which is exactly why measurement setup matters more than the creative brief.
Attribution: What To Build Before The First Post Goes Live
You cannot retroactively measure what you didn’t tag. Brands with clean ROI numbers make one decision upfront: how will each sale be traced? The 2026 attribution stack runs across several signal types — UTM links, unique discount codes, platform pixels, first-party checkout data, server-side events, creator storefronts, QR codes in Stories and Reels, and affiliate deep links. In practice, most campaigns need at least two of these working in parallel.
Unique discount codes are the floor. One code per creator, tracked to checkout. Simple, platform-agnostic, and doubles as a conversion incentive. The limitation: buyers who forget the code still convert — so treat code-driven sales as a minimum, not the full picture.
UTM links catch the browsers. A dedicated link per creator (utm_source, utm_medium, utm_campaign) shows sessions, add-to-carts, and conversions in your analytics. But UTM tags break across Stories, Reels, and creator reposts — a known failure mode that means you’ll undercount if you rely on UTMs alone.
Discount code deduplication matters more than most brands realise. If a buyer stacks a creator code with a sitewide promo, the source attribution gets muddied unless you explicitly deduplicate. Running stacked promotions without a dedup rule is one of the fastest ways to make your best creator look like your worst.
Real Numbers: What Influence Campaigns Actually Produce
Infliuence — the influencer marketing platform trusted by 500+ brands across India — publishes campaign data across its verified network. Two cases anchor what the benchmarks look like in practice.
Burger King’s campaign across 60 creators reached 7.4M views and 1.2M engagements, delivering 3.8x ROI. A separate food creator push on the same brand brought in 954k views at a 73% approval rate. Meanwhile, an Olay campaign reached 1.02M views with an 84% approval rate. These aren’t outliers — they reflect what happens when creator fit is verified before launch and tracking is baked in from day one.
The Burger King 3.8x figure is worth examining in context. The industry average sits at $5.78 per dollar invested, with top campaigns reaching $18–$20. At brand scale across 60 creators, 3.8x ROI is a defensible, provable result — the kind of number you can bring to a budget meeting, rebuild from, and scale. If your current campaigns can’t produce a number at all — if “ROI” in your reports means engagement rate — that’s the gap to close first.
What Counts As Revenue — Direct vs. Assisted

Influencer content rarely converts on the first touch. Someone sees a Reel on Monday, searches for your brand on Thursday, and buys through a retargeting ad the following week. Last-click attribution sends that sale to “paid social” and makes your creator look worthless.
Run two buckets: direct revenue (sales through the creator’s code or link — concrete, defensible, what you report to finance) and assisted revenue (conversions where influencer content was an earlier touchpoint, pulled from your analytics’ multi-touch path reports). For consideration-heavy or higher-priced products, assisted revenue often runs well above direct. Reporting only direct sales systematically undervalues top-of-funnel creators and pushes budgets toward bottom-funnel, discount-driven posts that perform short-term and erode margin long-term.
One signal worth tracking: the save rate on Reels. A Reel with a 2% save rate has been shown to outperform a Reel with 10% likes in downstream sales — saves signal purchase intent in a way that likes don’t. Similarly, a TikTok with a 6% like rate but 9.8-second average watch time and 1.7% click-through consistently outperforms one with 12% likes and shorter watch time. Vanity metrics aren’t just useless — they actively mislead budget decisions.
Post Decay: The Mistake That Underfunds Your Best Creators
Standard campaign reporting pulls a snapshot 7 days after posting. That’s fine for Instagram Stories. It’s wrong for TikTok and YouTube Shorts, where content compounds over weeks.
Ignoring post decay curves leads to underfunding evergreen creators who keep generating views — and attributed sales — long after a campaign’s reporting window closes. The fix is simple: pull creator performance again at 30 days and 60 days, not just at campaign close. The creators who look average at week one and excellent at week eight are the ones worth renewing at a higher rate.
A Six-Step Reporting Workflow
- Define one primary KPI per campaign — revenue, new customers, or email signups. Measuring everything means optimising nothing.
- Assign a unique code and UTM to every creator before content goes live. No exceptions.
- Log real cost per creator — fee, product COGS, boost spend, any licensing or editing costs.
- Track direct sales weekly so you can extend a breakout post while it’s still trending. Live Campaign Dashboards exist for exactly this reason.
- Pull assisted conversions at campaign close and report direct and assisted side by side.
- Rank creators by ROI and CPA, then rebrief or drop the bottom third and re-sign the top performers before they accept competing offers.
Step six is where compounding returns live. In every tracked program, a small group of creators drives a disproportionate share of measurable revenue. The job is to identify them inside the first campaign cycle and lock in the relationship before they accept competing offers.
The Fragmentation Problem — And Why It Kills ROI Visibility
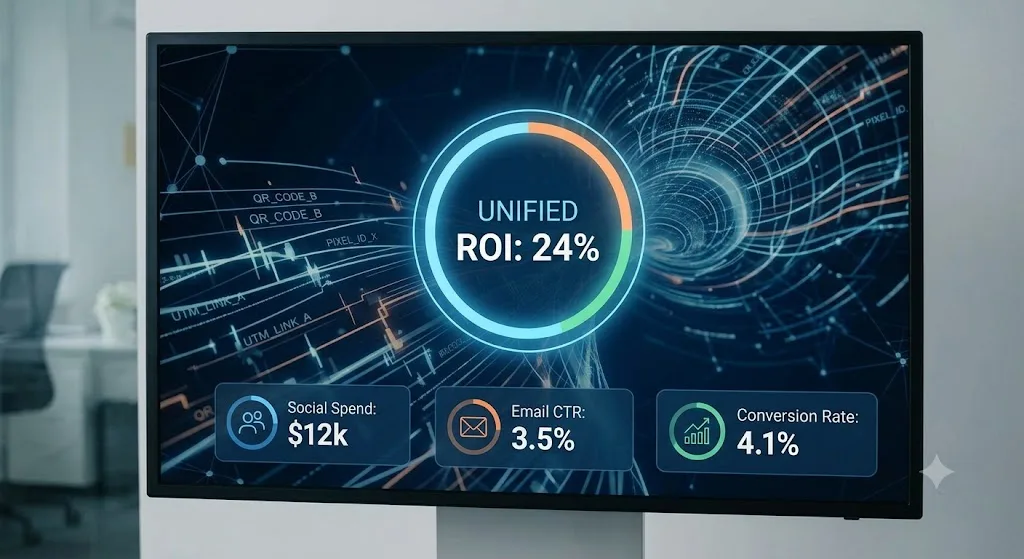
The hardest part of influencer ROI measurement isn’t the formula. It’s that the data lives in six places: codes in a spreadsheet, UTMs in Google Analytics, DMs in your inbox, creator invoices in email, engagement data on three separate platform dashboards. By the time you reconcile it, the campaign is three weeks stale and half the data is missing.
Running creator discovery, briefing, link management, and results in one dashboard is what makes weekly ROI reporting realistic rather than a quarterly fire drill. When every creator’s codes, links, and performance data roll up automatically, you see which creators drive revenue and which are just generating views — and you can act on that before the budget is spent.
Benchmarks: what “good” looks like with sources
The $6.50 average return per dollar and the $5.78 separate benchmark are reasonable sanity checks, but category matters. The influencer marketing industry reached $32.6 billion in 2026 — which means there’s enormous variance across verticals, creator tiers, and platforms. Use these ranges as a floor, not a target:
- Under 2:1 ROI — investigate before scaling. Wrong creator fit, weak offer, or attribution leakage.
- 3:1 to 4:1 — healthy and scalable for most DTC and e-commerce programs, consistent with the $5.78 industry average once full costs are factored in.
- 5:1 and above — top-performing campaigns with tight creator-audience fit and strong attribution. Replicate the inputs, not just the output.
- Cost per acquisition — compare each creator’s CPA against your paid-social CPA. Creators who beat it deserve renewal and more budget. Creators who don’t, don’t.
One consistent pattern: mid-tier creators frequently outperform mega-influencers on ROI because their fees are a fraction of the reach cost. Don’t chase follower counts. Chase cost per tracked sale.
Start measuring campaigns you can actually prove
Influencer marketing ROI stops being painful the moment discovery, campaign management, and results live in the same place. The full attribution and CPA tracking guide walks through how to build that stack end-to-end. When you’re ready to run campaigns against it, start your free Infliuence trial and make your next campaign one you can prove to leadership — with a number, not just a view count.